Playing with New Relic on Acquia Hosting
During the past month, I've been trying New Relic on my personal blog. New Relic is a performance management tool. It can help to monitor, debug and optimize a site. It includes features like slow page request analysis, slow database query analysis, error tracking, scalability analysis, performance alerts, weekly e-mail reports, up-time monitoring and even very specialized features like Apache Solr profiling. It's a bundle of developer goodies that can be used on live production websites.
I'm a bit of a profiling geek. In my previous life, I spent a lot of time working on production profiling and performance optimization of Java applications. So when New Relic recently announced that they're working on support for PHP applications, I wanted to give it a try.
We began testing New Relic when the PHP version was still in beta. We believe it can make for a great service to add to Acquia Hosting and the Acquia Network. My site is hosted on Acquia Hosting which is why I have been testing it on my site. So far the testing has been good. We've helped New Relic fix a number of bugs during the beta test period, and in return New Relic has helped us to discover a performance problem in one of our deployment scripts on Acquia Hosting. Proof that New Relic is useful!
Now that we are past internal testing, I am excited to say that we will soon be bundling New Relic into the Acquia Network. Every Acquia customer will soon get access to a premium version of New Relic's monitoring tools at no additional charge — whether you are hosting with us or not. Expect more detail from us soon on how to access New Relic as a subscriber.
New Relic requires a small 'agent' to be installed on your web server. The agent hooks into the PHP interpreter and sends the relevant information to a back-end for analysis and visualization. Because it hooks into the PHP interpreter, it can provide that deep, code-level visibility that is useful when debugging a performance problem. The New Relic agent also adds extra Drupal specific instrumentation — and will probably add more over time.
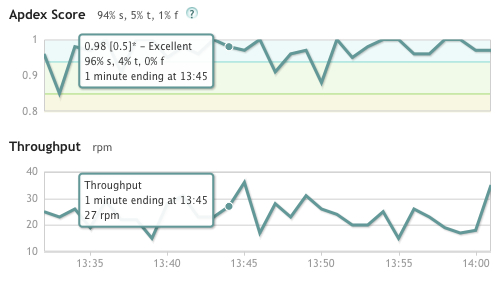
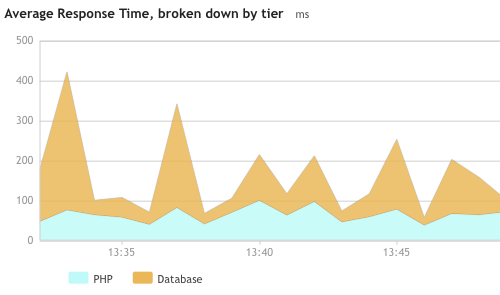
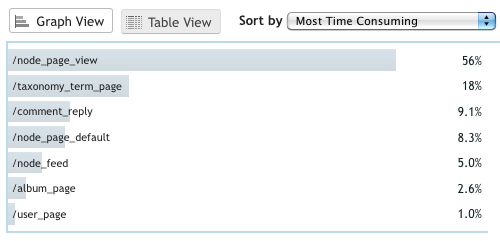
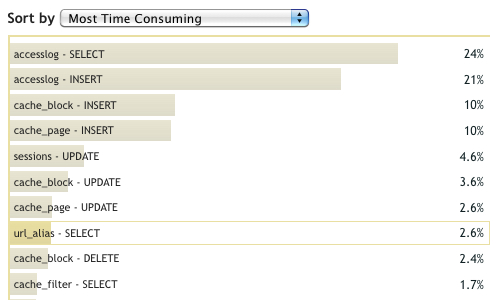
I've only used it on my personal site, which currently runs on a regular Drupal 6. However, I'm quite keen to unleash it on a Drupal 7 installation to see what we can learn. In the mean time, I'm including some screenshots of what my personal blog looks like according to New Relic. If you're interested in improving the performance of your site and are a profiling geek like me, you should give New Relic a try.


/article/11/19/why-mysql-is-cool and /article/11/19/postgres-is-cool and so on) that are all handled by the same controller (e.g. node_page_view()).
accesslog MySQL table. By disabling the access log feature in Drupal, I could reduce my database load roughly in half.— Dries Buytaert
Dries Buytaert is an Open Source advocate and technology executive. More than 10,000 people are subscribed to his blog. Sign up to have new posts emailed to you or subscribe using RSS. Write to Dries Buytaert at dries@buytaert.net.